For reasons I don’t really understand, I was drawn to expressing my Cystic Fibrosis through art. Some people may think of “disease and art” as a somber subject. Spanish Flu period pieces, 17th century plague doctor, and the like. But it never really felt like that to me.
I grew up in the world of 65 roses. It’s the kind of spirit where we give our disease a dumb, quirky name. Where the fundraisers are way too fun to even notice you’re supporting a charity. Where my Walkathon team has more clothing designs than the Golden State Warriors.
With that upbringing, my artistic journey began as an 18-year-old. As a biology-curious high-schooler, I happened to get my hands on a copy of the original genetic test with my CF results from my infancy. That’s when I first became aware of the names of my two CFTR mutations: ΔF508 and G551D. I was learning about things like mitosis and transcription those days, and went down some rabbit holes to learn more.
Side note: Two years later, I found out that the investigational drug ivacaftor (now a blockbuster drug named Kalydeco) had started recruiting patients with certain rare CFTR mutations. One of those mutations happened to be none othan than G551D.
Like any good basketball player, I decided that it would be cool to get these variant names tattooed on me. A couple key facts were not unbeknownst to me as the needle met my skin in a random tattoo shop outside of Pittsburgh. My tattoo was taking place 18 years after the identification of the CFTR gene led by Francis Collins, Lap-Chee Tsui, and John Riordan in 1989. The timing also corresponded to the 18-year life expectancy often cited in CF articles written in the 90s. I guess 18 is something of an important number. If I ever become a dark wizard, I’ll be sure to create 18 Horcruxes.
It was only fitting then, that after another 18 years from that moment, it was time to embark on the next phase of the journey, this time naturally shifting from tattoo guns to programming.
Warning: the next section includes specifics on the technical details. Jump to Section 3 if this will put you to sleep.
1. Getting the sequence
I did not approach this endeavor with a single finished idea in mind. But I did know that I wanted to play around with the CFTR DNA sequence and a pen plotter. The entrez R package allowed me to easily query genetic sequences publicly available from NCBI (National Center for Biotechnology Information). Specifically, I was able to pull the Coding DNA Sequence (CDS) corresponding to Homo sapiens CFTR mRNA. There are a variety of different CFTR-related contributions from different researchers; I decided to roll with this one (based on the sequencing described here) since it had good vibes.
The CFTR gene is located in band 31 at the long arm (q arm) of chromosome 7 (7q31.2). Based on my NCBI reference, the entire gene sequence is 6070 nucleotides long. For my artistic preferences of working with a smaller number of nucleotides, I decided to ditch the other junk like the non-coding regions and untranslated regions. Therefore, I rolled with nucleotides 71-4153, corresponding to the part of the DNA sequence that transcribes the RNA that actually gets coded into protein, AKA the CDS.
Now I’ve got a “healthy” sequence, but how about my special flavor, the ΔF508? Well there are three components to its name: 1) the “delta”, corresponding to a deletion, 2) the F, corresponding to the amino acid Phenylalanine, 3) the 508, referring to the position of the amino acid in the CFTR protein. In other words, Phenylalanine is getting deleted at the 508th codon in the CDS (the nucleotide starting at position (508-1)*3 + 1 = 1522 in the CDS).
In the RNA, Phenylalanine is composed of the nucleotides UUU or UUC. Thus, in the CDS, the deletion should be a TTT or TTC. This provides a nice sanity check to make sure I cut out the right DNA.
Alright, no more biology! Time to play with these letters.
2. Plotting the genes
I naively thought that I would do what I always do - whip up some ggplot, make some fun plots, then save them as JPEGs. But pen plotters don’t speak the language of JPEG, they speak the language of SVG. I had to stop thinking of my plot as an “image” and more like vector-based “instructions” for the machine to read and execute on.
I was able to hack my way to a seemingly successful plot. I leaned on svglite to turn base R plotting into vector graphics. I played around with a couple different ways of portraying the sequence: one where it simply plots the literal nucleotide letters, and one where it plots a symbol with each color corresponding to a specific nucleotide. To ease the demand on the plotter and ensure it doesn’t take five years to plot, the latter approach with small circles was the winner.
Adjusting my brain to the world of vectors took some time. Never in my data science life did I have to think about where in the plot the drawing “starts”, it simply goes from 0 to complete. In the world of letters, I learned about the importance of single-line fonts like Hershey Fonts. You don’t want the pen to have to waste unnecessary effort doing multiple strokes for a single letter.
While this initial effort passed the eyeball test and looked like a success, there were a lot of inefficiencies that needed to be worked through. Different colors needed to be “grouped” in the SVG so that the pen would plot all nucleotides in one color, then all nucleotides in a different color, etc. Having to do hundreds of manual pen switches for different colored pens isn’t ideal. There are still plenty of issues around automatic sizing and spacing that I can optimize better. If there’s ever a future where these are getting mass produced, I’ll need to be sure that the pen draws the nucleotide in a serpentine pattern, instead of only drawing left-to-right, left-to-right, left-to-right.
3. The visuals
Now for the grand reveal…
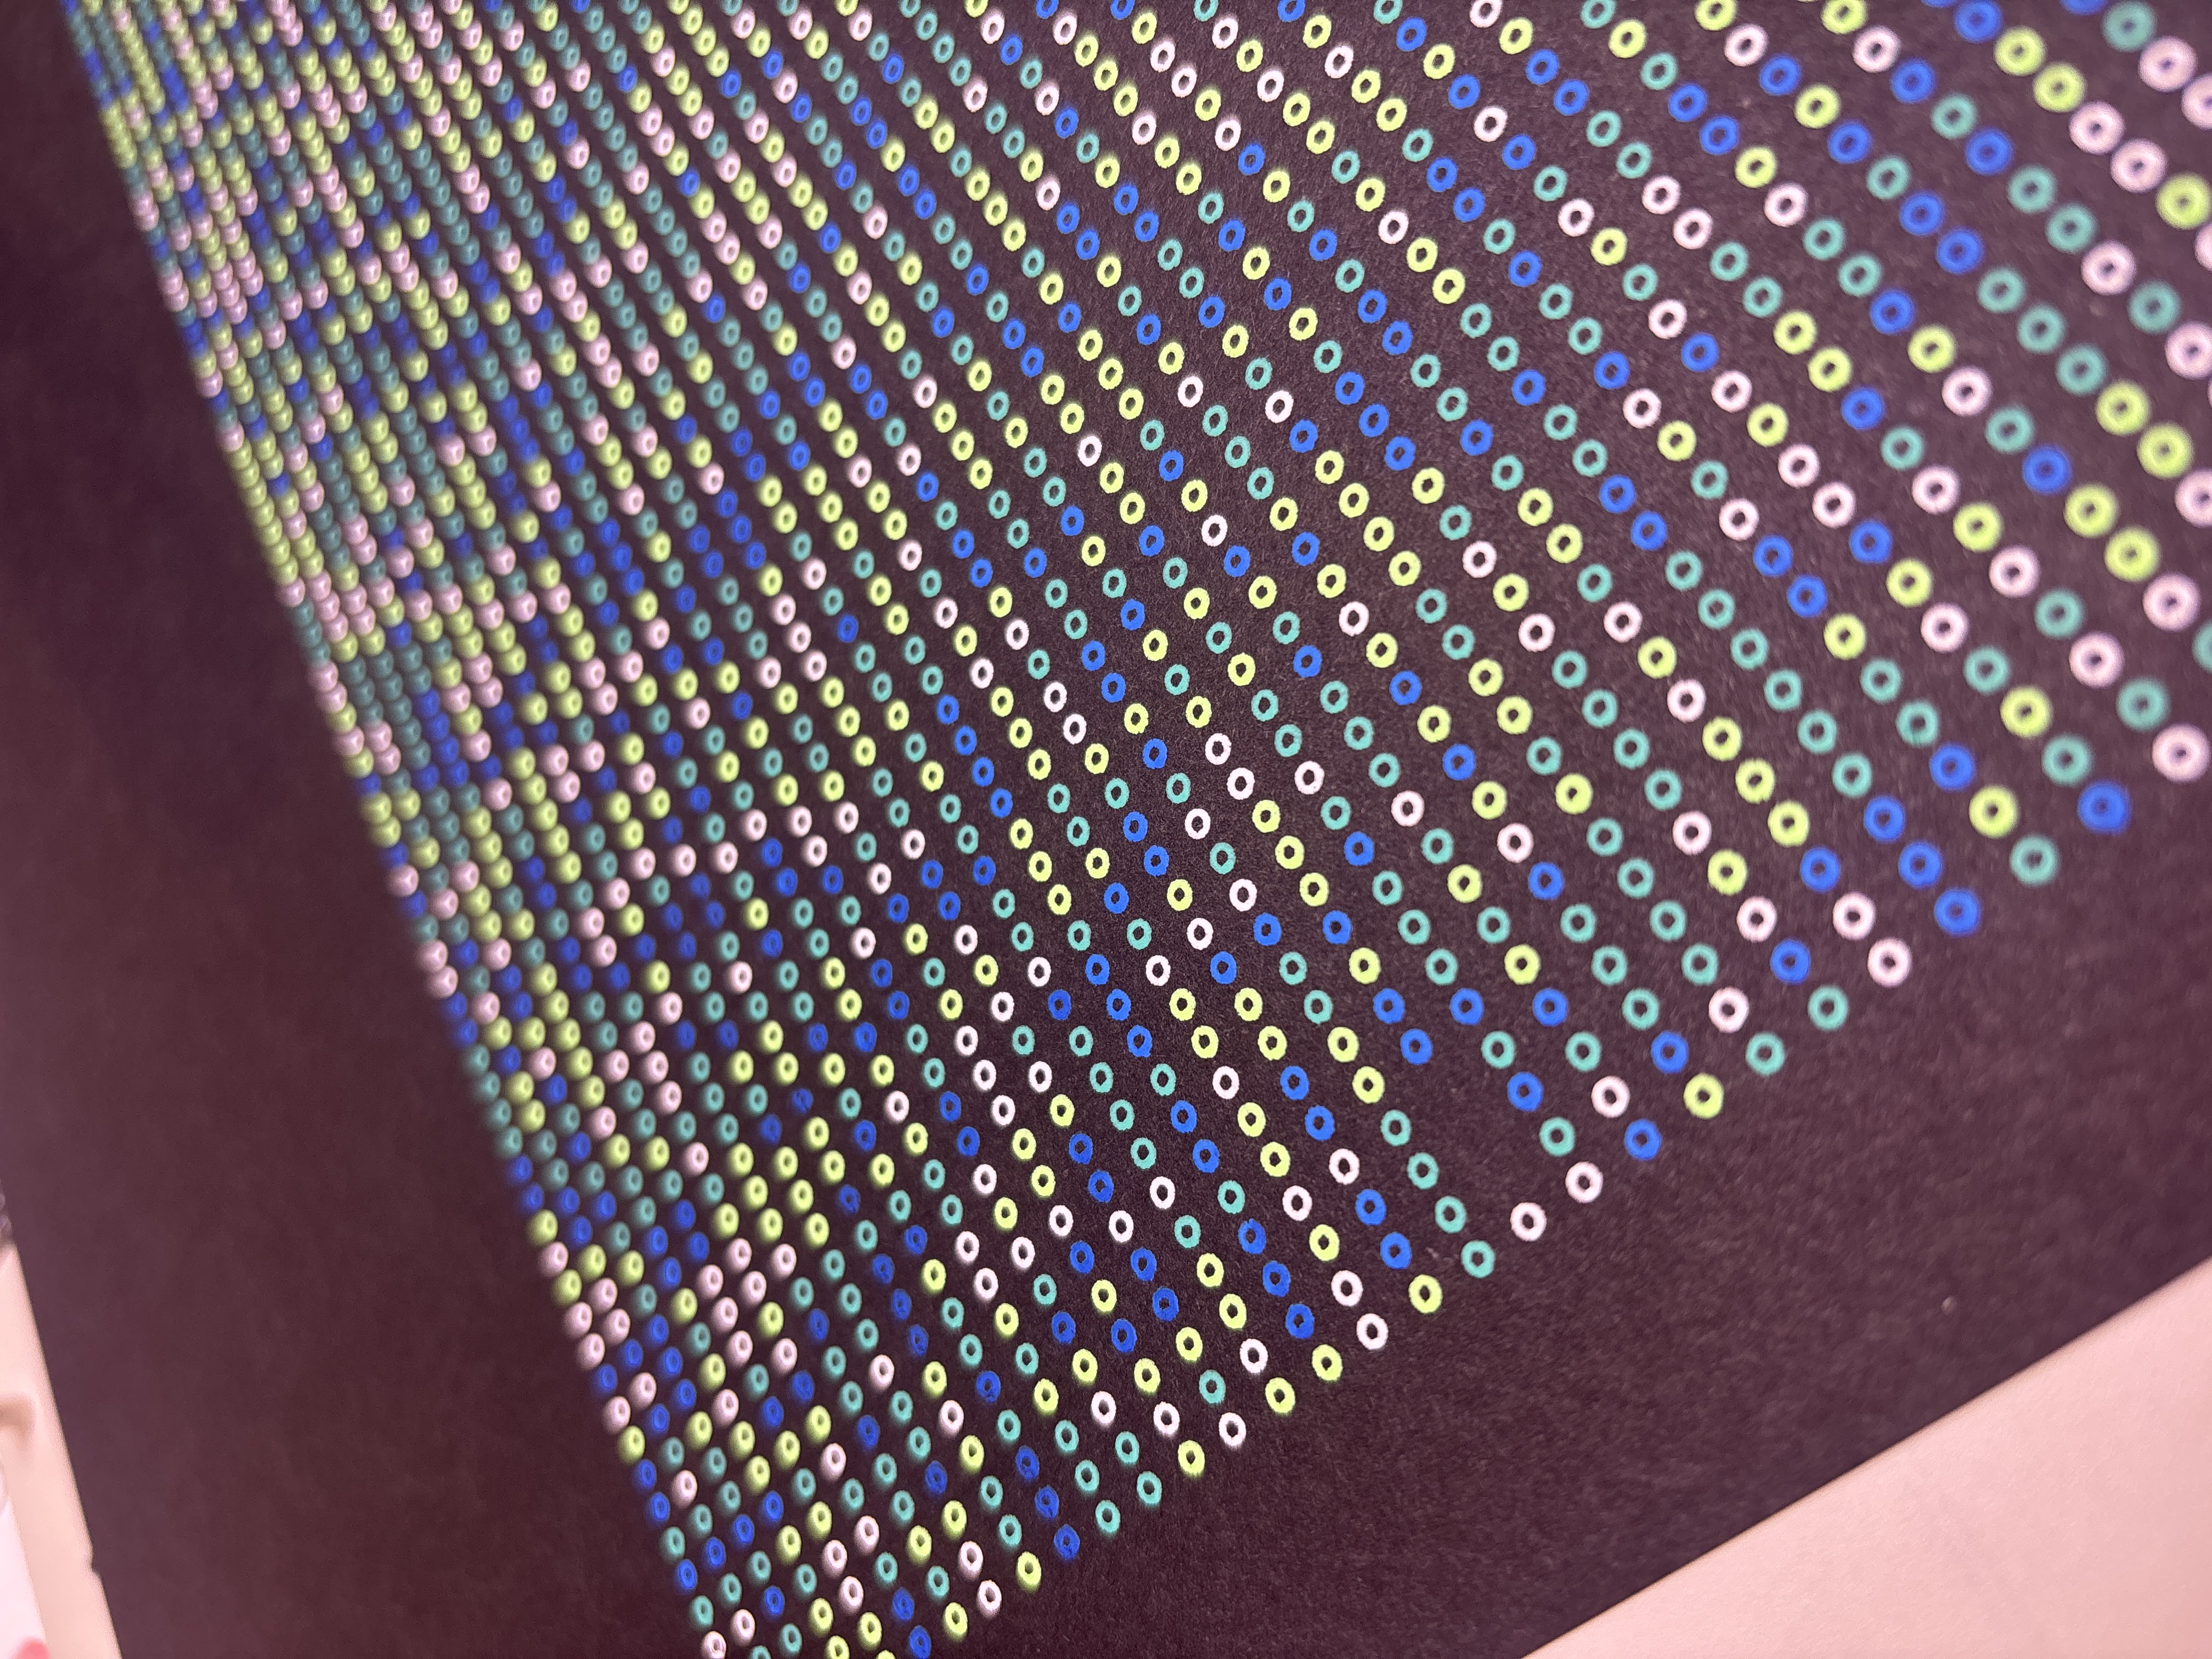
The source plot is below. The nucleotide-color key is as follows: A = green, T = red, C = blue, G = yellow.

You can see the deletion in the sequence in the left-middle section of the plot. It only takes a few missing dots to change the trajectory of your life. Sometimes a visual like this drives it home a lot harder than any clinical report.
Now for a close-up…
Special thanks to Russell Taylor for his robot whispering. See his art at Drawscape.
I can only wonder what’s in store for me 18 years from now. Make sure your VR headset is strapped and ready for the next development!